Pearson correlation: interpreting and reporting the result
Read a Pearson correlation, scatterplot, two-sided test and confidence interval using a complete undergraduate research example with traceable input and output files.
Start with the research question and the two scores
Does greater academic self-efficacy go together with greater learning persistence? That is H1 in the basic research example, a cross-sectional questionnaire study with 180 undergraduate respondents. It asks about an association, not an intervention or change over time.
The study brief specifies two separate scores. Academic self-efficacy is the mean of q1_1–q1_5; learning persistence is the mean of q2_1–q2_5. Answers range from 1 to 5. The codebook records no reverse-scored items or missing values in this example. Combining all ten items would answer a different question.
For your own data, follow the instrument's scoring instructions before correlating scores. Resolve reverse coding and missing-value codes explicitly; do not turn a missing answer into zero. The alpha guide covers scale checks, and the descriptive statistics guide explains the two scores' distributions.
Read the scatterplot alongside r
Pearson r summarizes the direction and strength of a linear association, on a scale from −1 to +1. Positive values mean that higher scores on one measure tend to accompany higher scores on the other. A value near zero does not rule out a curved relationship.
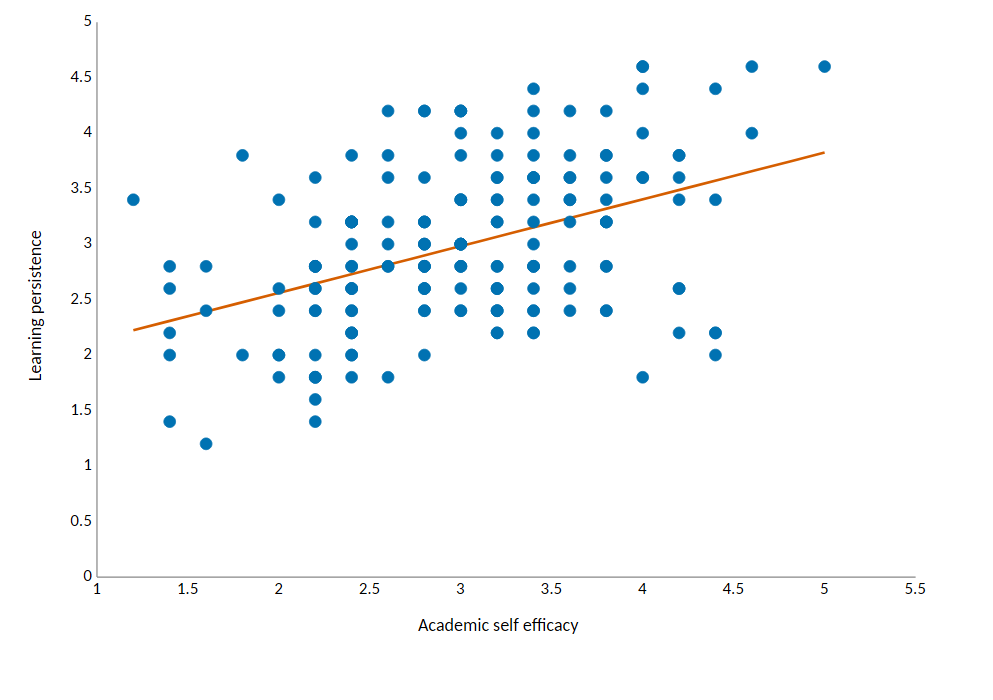
In the published scatterplot, self-efficacy is on the horizontal axis and persistence on the vertical axis. The upward trend has substantial scatter: students with the same self-efficacy score can report different persistence scores. The fitted line is not each student's trajectory.
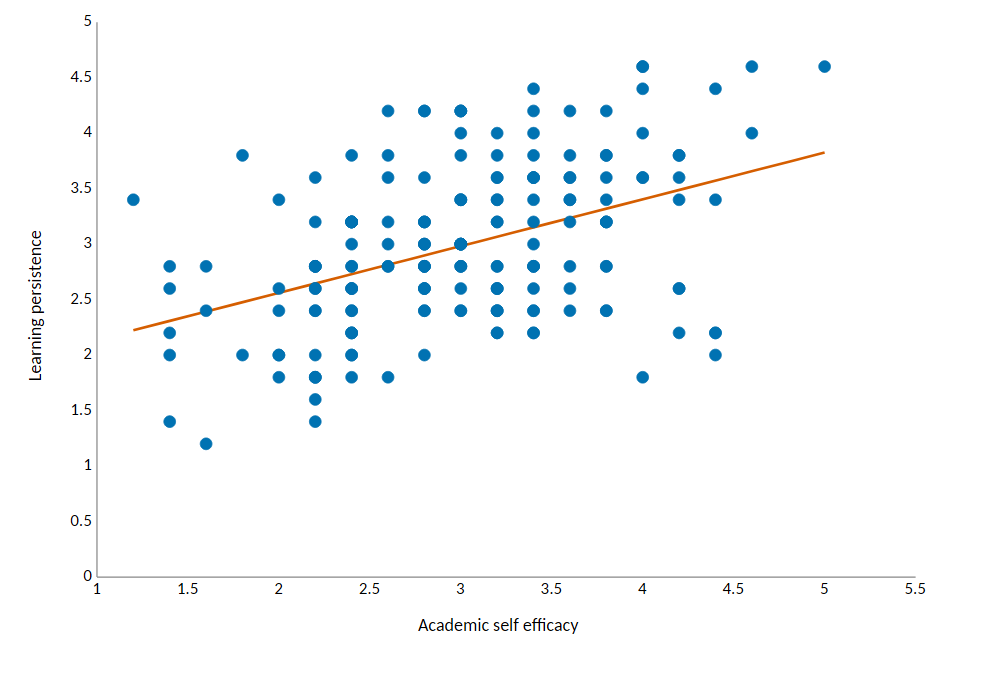
NIST's scatterplot guide describes checking shape, changing spread and unusual observations. Inspect those features rather than relying on r alone. Investigate an unusual point against its source; do not remove it simply to raise the correlation.
Read the coefficient, test and uncertainty separately
The following values were recalculated from the prepared data, and match the complete numeric output. Both scores also match the means recalculated from the original item data.
| Quantity | Result |
|---|---|
| Complete pairs, N | 180 |
| Pearson r | .435 |
| 95% Fisher-z confidence interval | [.308, .546] |
| Test statistic, t | 6.44 |
| Degrees of freedom | 178 |
| Two-sided p | < .001 |
The positive r describes the observed direction. Its size needs the measures and research context, rather than a universal label alone. The interval expresses sampling uncertainty about the population correlation under the method's assumptions; it is not the range containing 95% of students' scores.
The R documentation describes the Pearson test against zero correlation and the approximate Fisher-z interval. Here the test uses 178 degrees of freedom. Although H1 expects a positive association, the study plan explicitly chooses a two-sided test. Its p value is about 0.00000000108; report p < .001, not p = .000. Statistical significance does not determine practical importance.
Check the unit of observation and analysis decisions
The two scores belong to the same respondent; the 180 rows represent different respondents. Repeated observations from the same people or clustered sampling need appropriate analysis, rather than treating every row as independent.
The usual t test has its exact reference distribution under independent pairs from a bivariate normal population; the Fisher-z interval is approximate. Bounded questionnaire scores need assessment rather than an assumption that sample size guarantees this model.
For other datasets, document the scoring rule, available complete pairs and treatment of missing responses. A normality-test p value alone cannot select the right correlation method or establish all assumptions. Rank correlation addresses a different summary of association; changing methods requires a reason tied to the question and data.
A reporting paragraph and its limits
“Among 180 undergraduate respondents, academic self-efficacy was positively associated with learning persistence, r(178) = .435, 95% CI [.308, .546], p < .001, two-sided. Students reporting greater self-efficacy tended also to report greater persistence.”
The squared correlation is about .189. In a simple linear regression with an intercept using these same two scores, that equals the model's R². It is not 43.5% or 18.9% of participants, an intervention effect, or a result adjusted for other variables. This cross-sectional self-report study does not establish that self-efficacy causes persistence.
Compare the complete numeric output with the findings chapter. The chapter rounds r to .43; this guide uses three decimals from the same value. The results-chapter guide explains how to place the result within a report. Deliverables depend on the agreed scope; consultation and ordering remain closed.
See the complete research examples
Follow the research questions through the input files, analysis plan and outputs. Each example includes the consultation report, itemized illustrative price and generated files.
Basic example · undergraduate level
Academic self efficacy and learning persistence
A questionnaire study with two scales and one association hypothesis: reliability, descriptive statistics and a Pearson correlation.
Advanced example
Job autonomy, supervisor support and work engagement
A three-scale study with factor analysis, reliability, three hypotheses including regression, and an additional background-adjusted model.