Research examples illustrating the service · Basic example · undergraduate level
Academic self efficacy and learning persistence
A questionnaire study with two scales and one association hypothesis: reliability, descriptive statistics and a Pearson correlation.
180 participants · 2 scales · 1 hypothesis
The study at a glance
A cross-sectional correlational study of students in their first three undergraduate years. Each participant completes two five-item scales and reports their year of study once, without group assignment.
Research objective
Examine whether students who report greater academic self efficacy also report greater learning persistence.
Research questions
- How are academic self efficacy and learning persistence associated?
Research hypotheses
- H1: Academic self efficacy is positively associated with learning persistence.
What does the analysis include?
Examining the measurement structure
Each score is the mean of its own five items, on a 1–5 scale. This example has no reverse-scored items or missing values. The two scales are kept separate.
- Cronbach alpha reliability for each of the two scales.
- Mean scoring for each scale, with sample, item and composite descriptives.
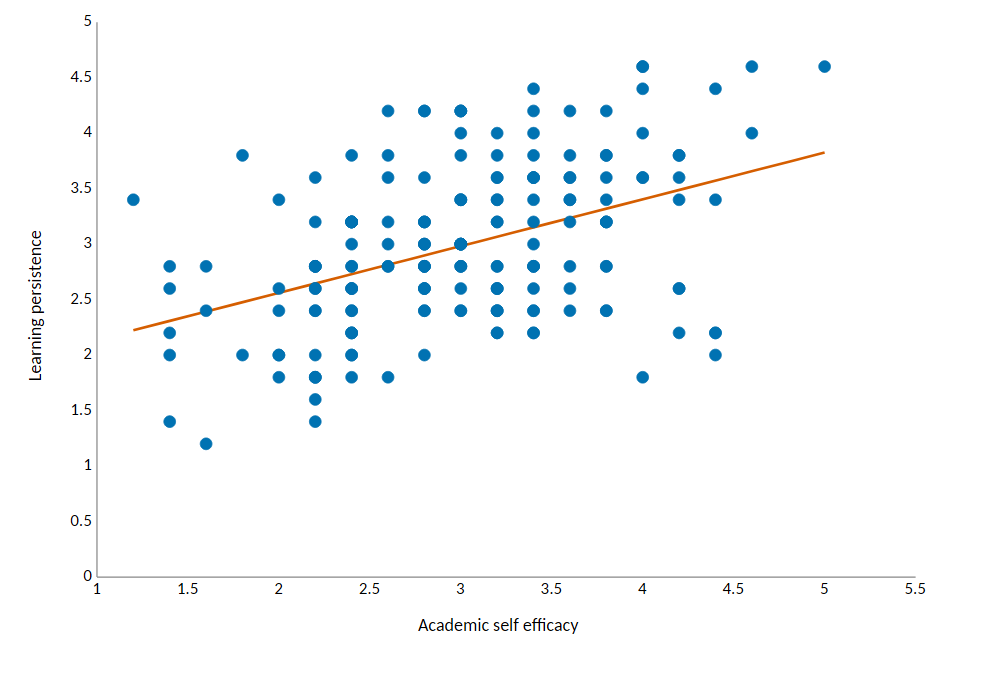
- Examination of the scatterplot and relevant assumptions, followed by a two-sided Pearson correlation for H1.
- Reporting of the association and its uncertainty, with an explanation of its meaning and limits.
What can the study tell us?
The study describes an association between self-reports measured once. A statistically significant association cannot establish that self efficacy causes persistence. Reliability assesses consistency between items and does not replace instrument validation.
Understanding the analyses in this example
Input files: where the analysis starts
Open the study brief, questionnaire, codebook and dataset to see the basis for the analysis. Each dataset row represents one participant.
Preparing your own file? Read the guide to preparing research data.
Outputs: what do you receive?
Explore each output or download the package. The documents describe the same study and analyses; the data and software outputs let you inspect the results and continue working with them.
Start with the findings chapter and explanation guide, then explore the underlying analysis outputs.
For the chapter structure and the distinction between findings and interpretation, read the guide to writing a results chapter.
Download the full output package (ZIP)Consultation, analysis plan and itemized price
How variables and hypotheses were understood, which tests were selected, and the illustrative price breakdown.
- quote-example.html(HTML)View(new tab)Download
- quote-example.json(JSON)Download
- quote-example.md(MD)Download
- report.html(HTML)View(new tab)Download
- report.json(JSON)Download
- report.md(MD)Download
Findings chapter
Research findings, tables and figures with statistical reporting for each hypothesis.
- findings_chapter.docx(DOCX)Download
- findings_chapter.json(JSON)Download
- findings_chapter.md(MD)Download
- findings_chapter.pdf(PDF)View(new tab)Download
Methods section completion
Tests performed, scale scoring, data handling and assumption checks.
Relevant discussion guidance
Interpretation and limitations; connect the findings to your own research literature and sources.
- discussion_guidance.json(JSON)Download
- discussion_guidance.md(MD)Download
- discussion_guidance.pdf(PDF)View(new tab)Download
Assumption check records
Structured check records. Readable explanations also appear in the methods, process report and software output.
- canonical_results.json(JSON)Download
How the work was done
Analysis decisions, completed steps and instructions for repeating the tests.
Quality check report
A checklist of output checks, including agreement between calculations and reporting.
- quality_check_report.json(JSON)Download
- quality_check_report.md(MD)Download
- quality_check_report.pdf(PDF)View(new tab)Download
Explanations and advisor meeting guide
Why each test was chosen, alternatives considered and how to explain the results.
- advisor_guide.docx(DOCX)Download
- advisor_guide.json(JSON)Download
- advisor_guide.md(MD)Download
- advisor_guide.pdf(PDF)View(new tab)Download
Data and software output
SAV data, rerunnable syntax and SPSS-compatible output for detailed inspection.
Analysis data file
The data and scores used in the calculations, in CSV format.
- clean_data.csv(CSV)Download
Codebook
Variable names, meanings and coding for interpreting and reusing the files.
Charts and editable Excel workbooks
Findings and background charts with underlying chart data and editable workbooks.
- 00_pearson_correlation.png(PNG)View(new tab)Download
- 00_pearson_correlation.xlsx(XLSX)Download
- graphs_appendix.xlsx(XLSX)Download
- graphs_body.xlsx(XLSX)Download